
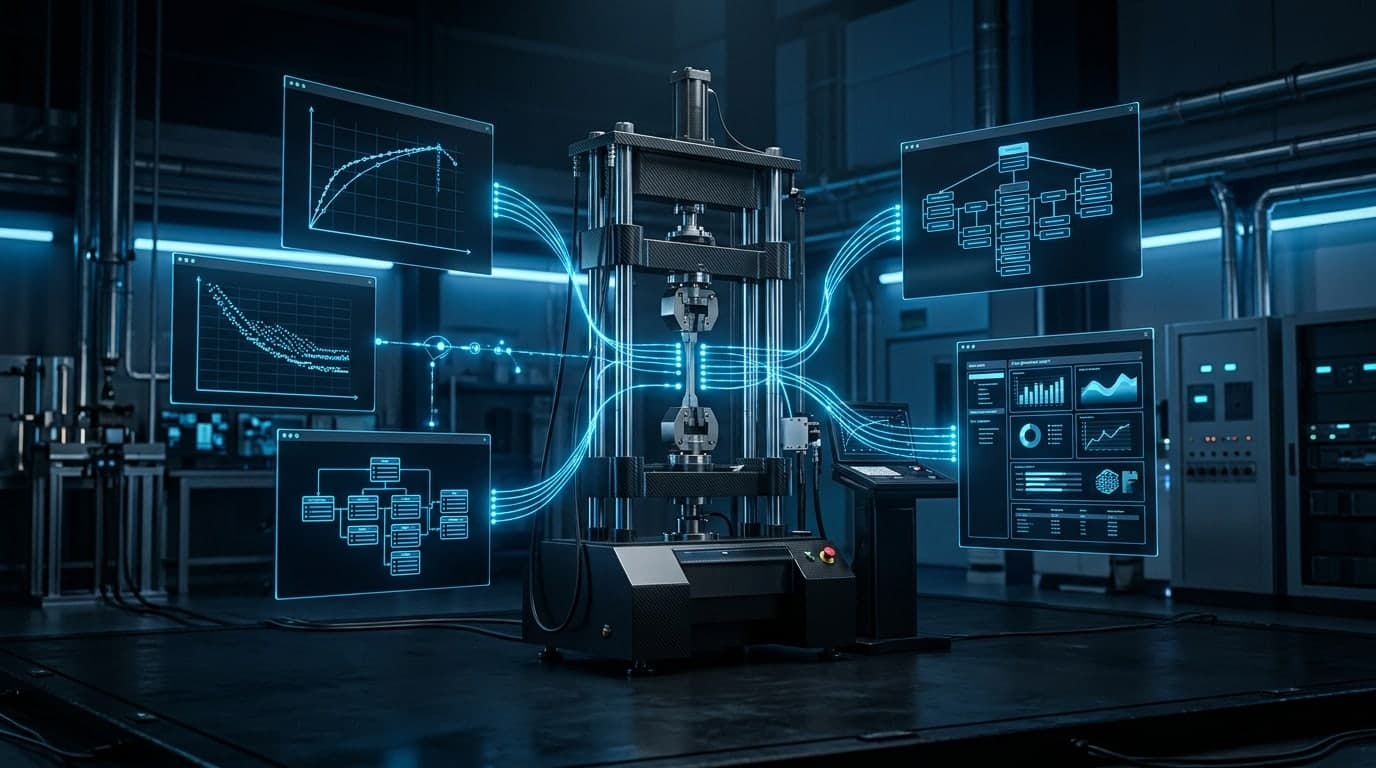
Materials Testing Automation
Automating materials test data analysis to international standards
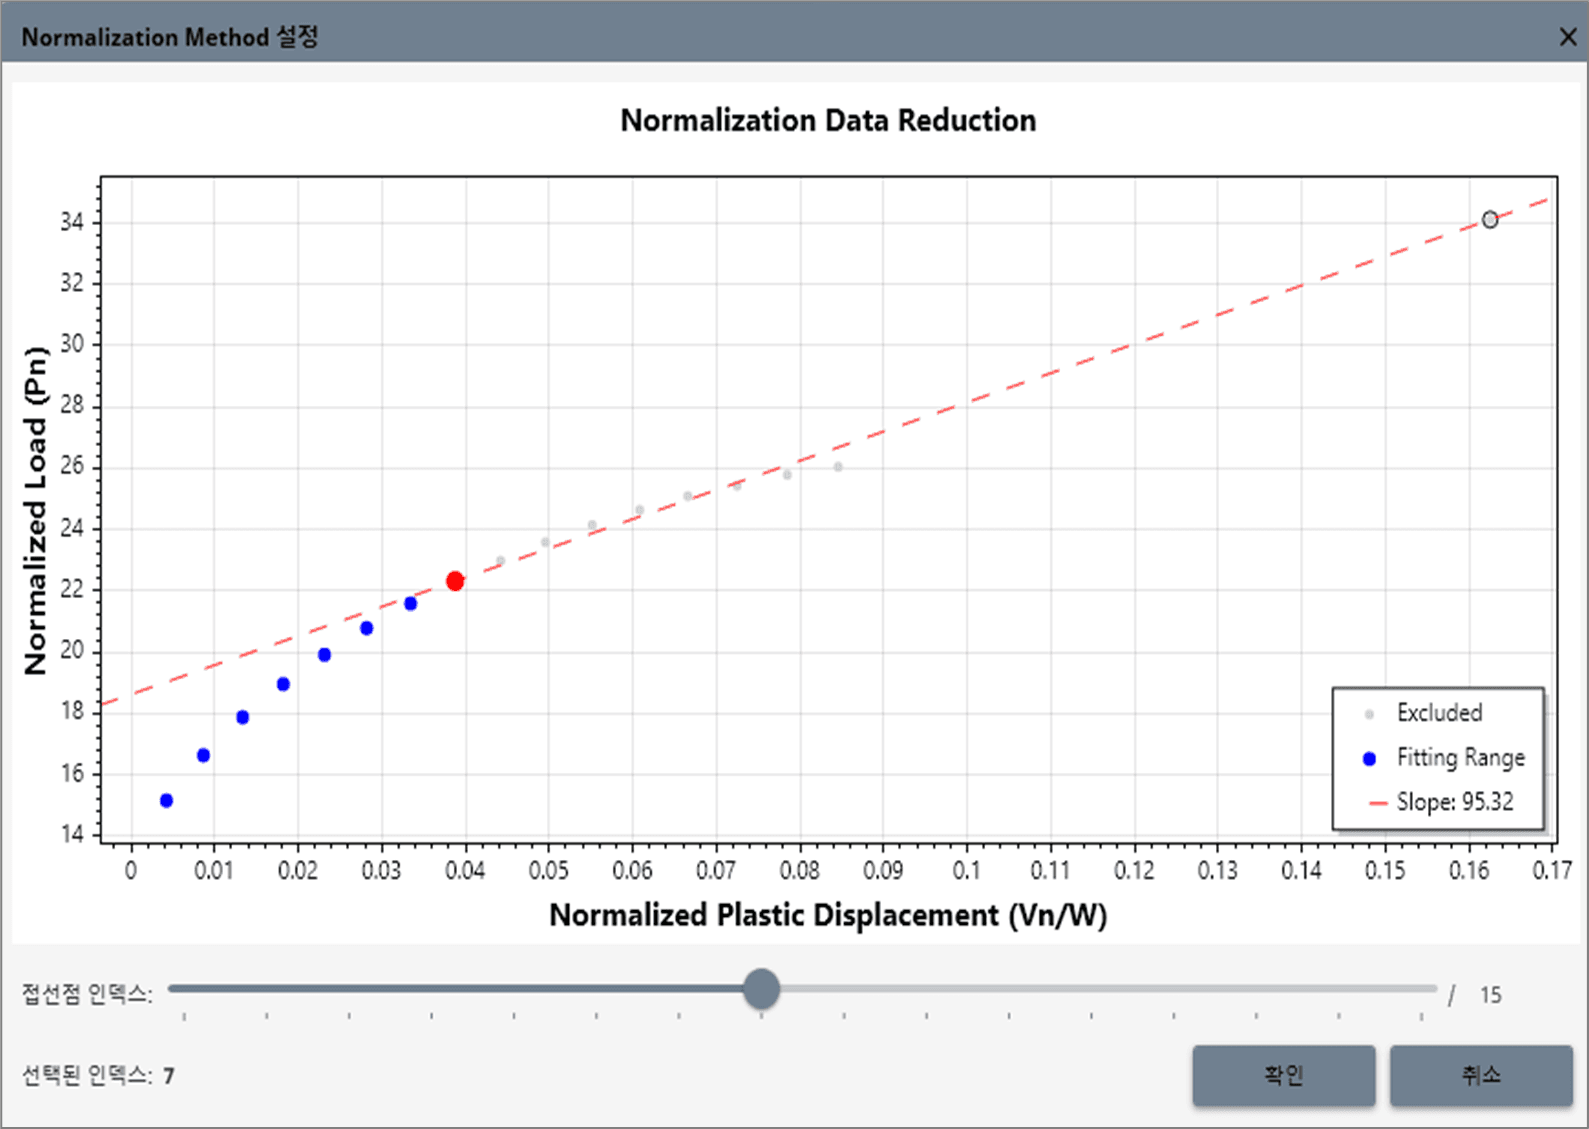
Standard algorithms automate fracture toughness (ASTM E399, E1820) and grain size (ASTM E112) analysis, handling everything from value calculation to validity checks and test report generation in a single workflow.
We have turned materials test data interpretation, which once relied on manual work, into software based on international standards. With raw data as the only input, this materials testing automation suite performs standard calculations and validity checks and generates test reports automatically.
Fracture Toughness (ASTM E399)
Automated KIc fracture toughness analysis
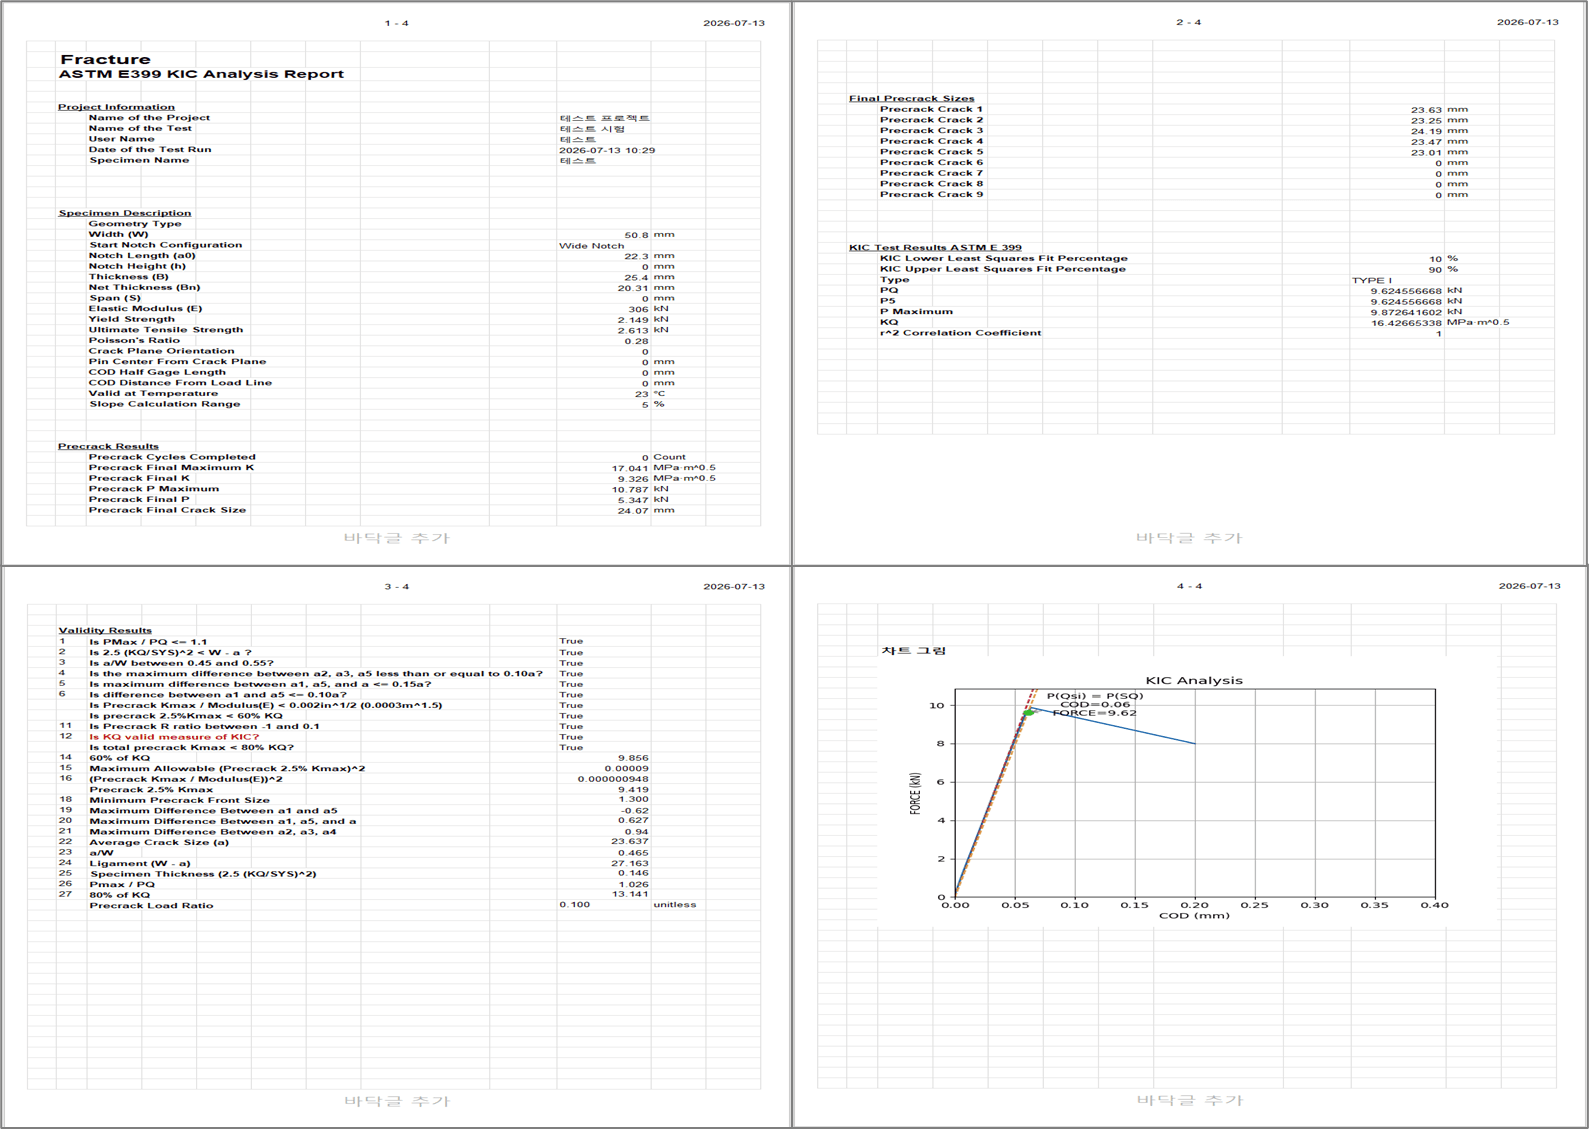
Automated ASTM E399 analysis, including fracture toughness validity checks
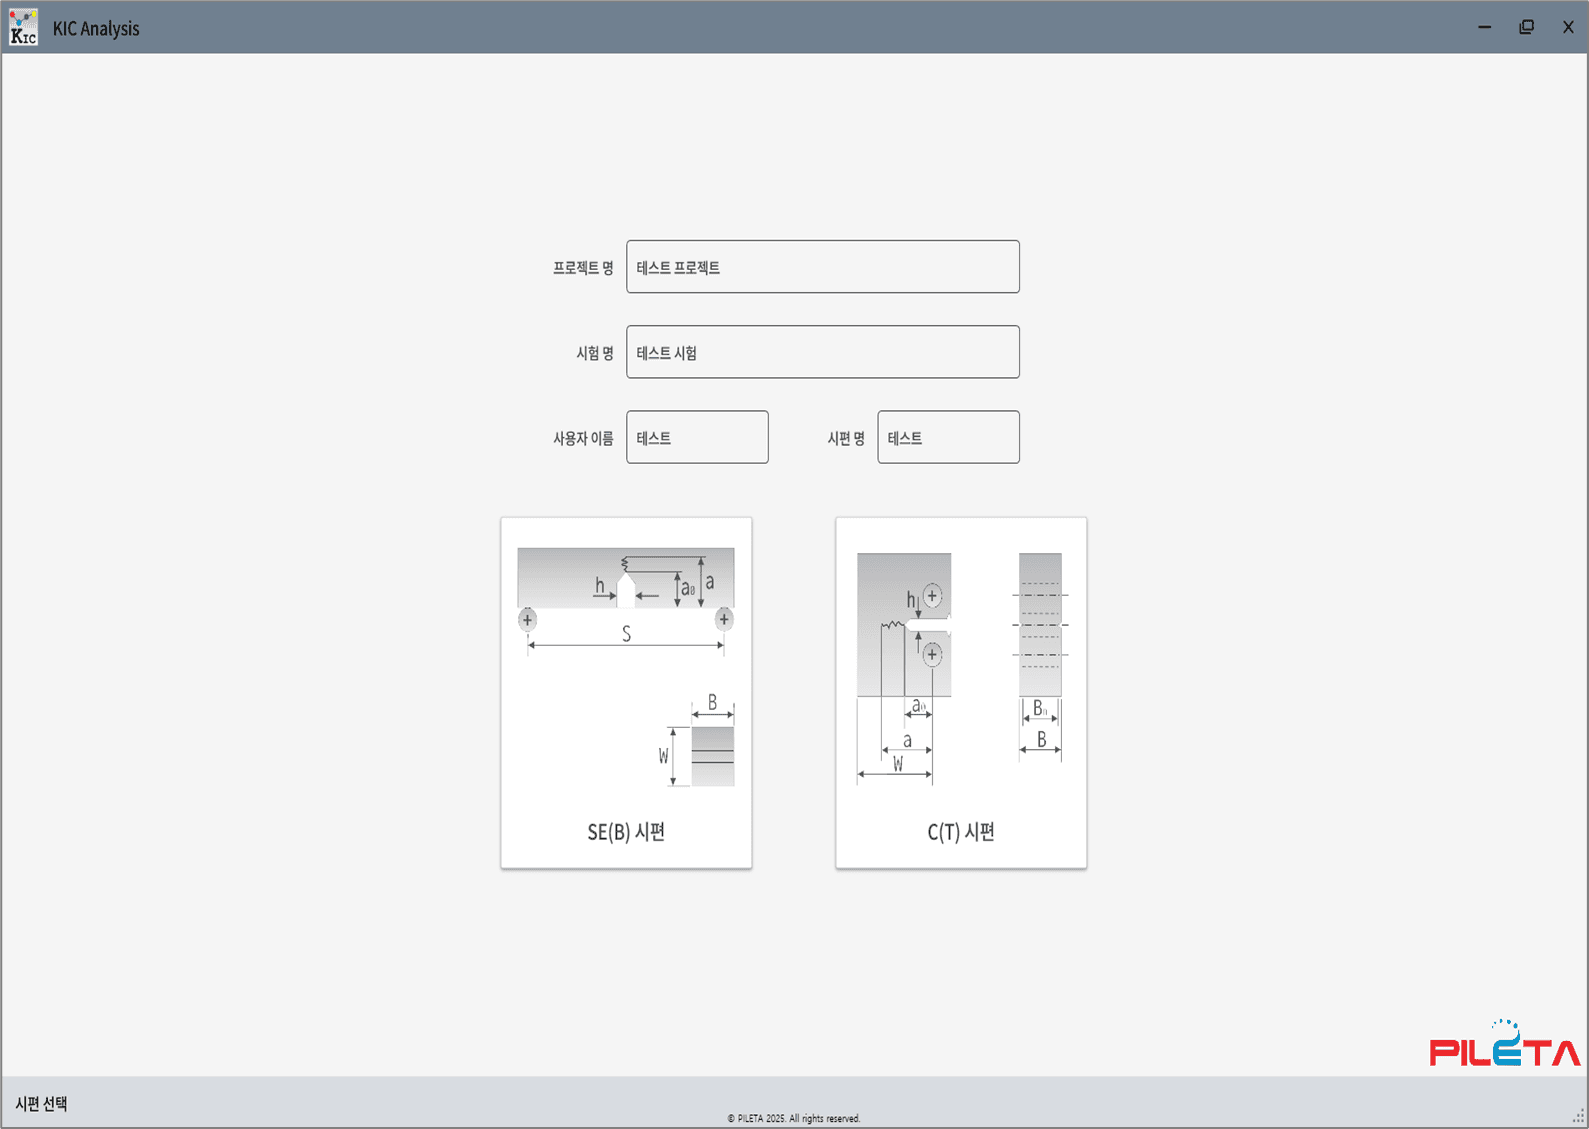
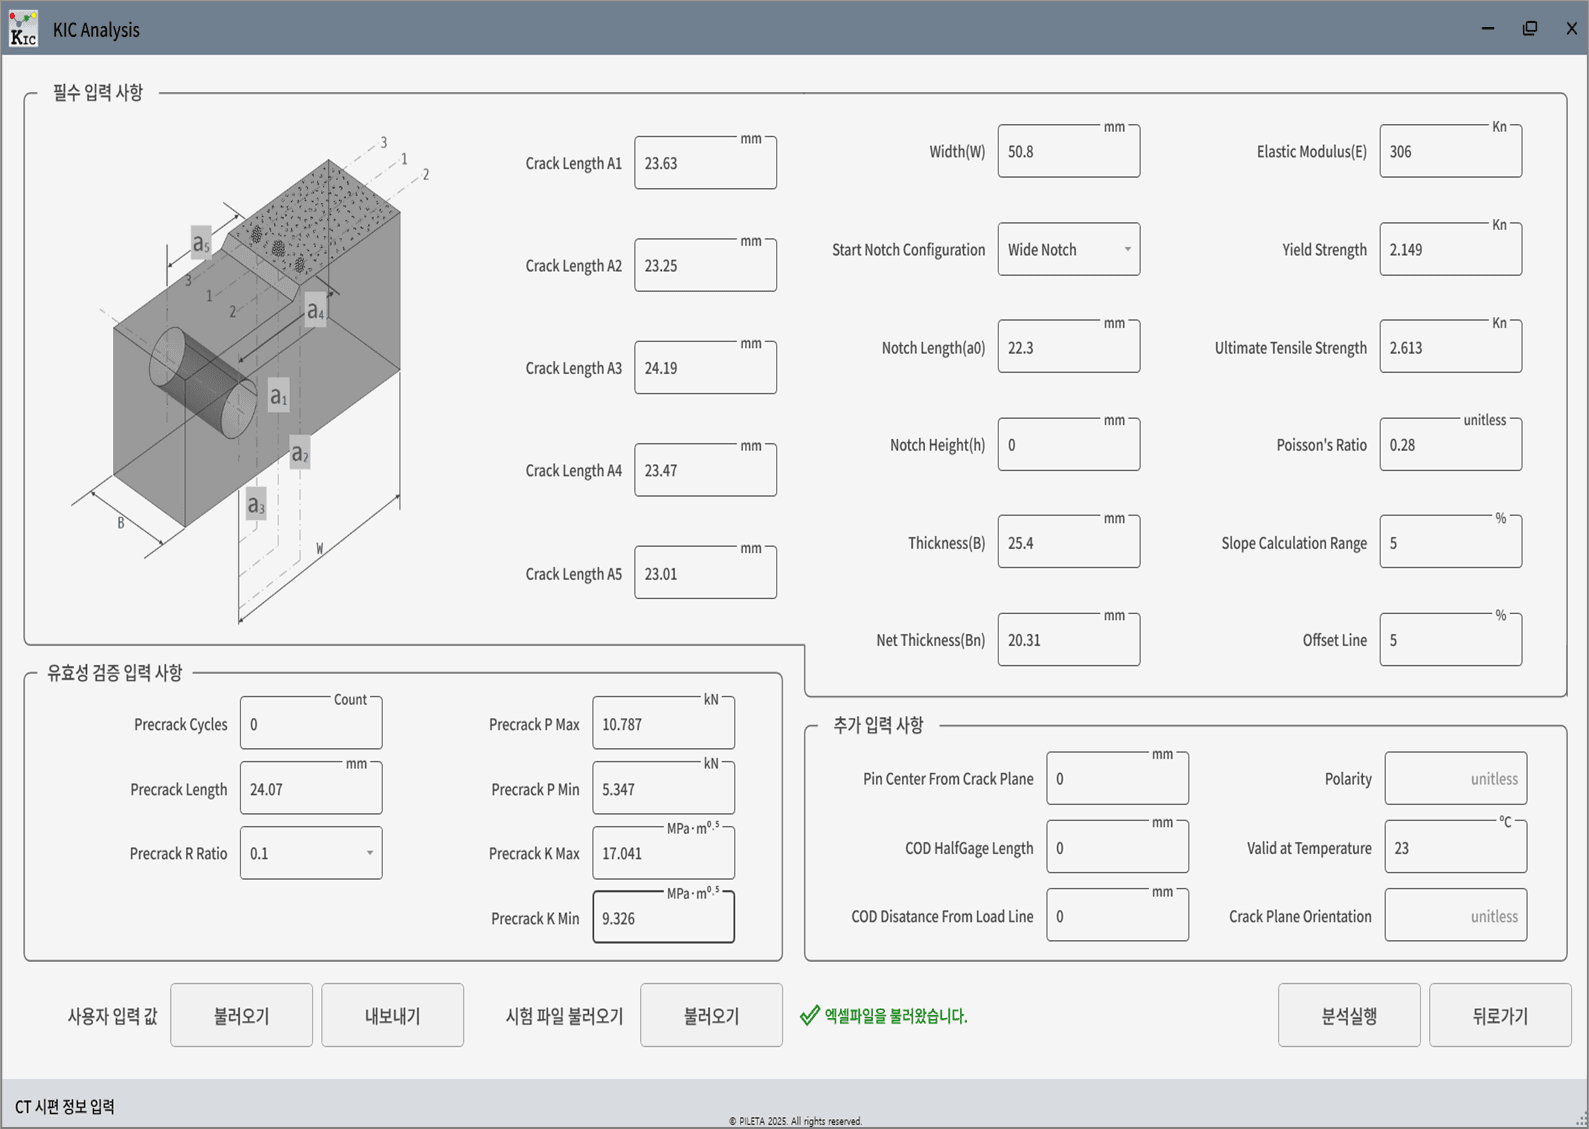
Desktop software that automatically analyzes raw fracture test data in accordance with ASTM E399 and determines whether the fracture toughness value is valid.
Standards-based automated analysis
Import raw load–crack opening displacement (COD) data (CSV) to calculate the stress intensity factor and fracture toughness in accordance with ASTM E399.
Automatic validity check
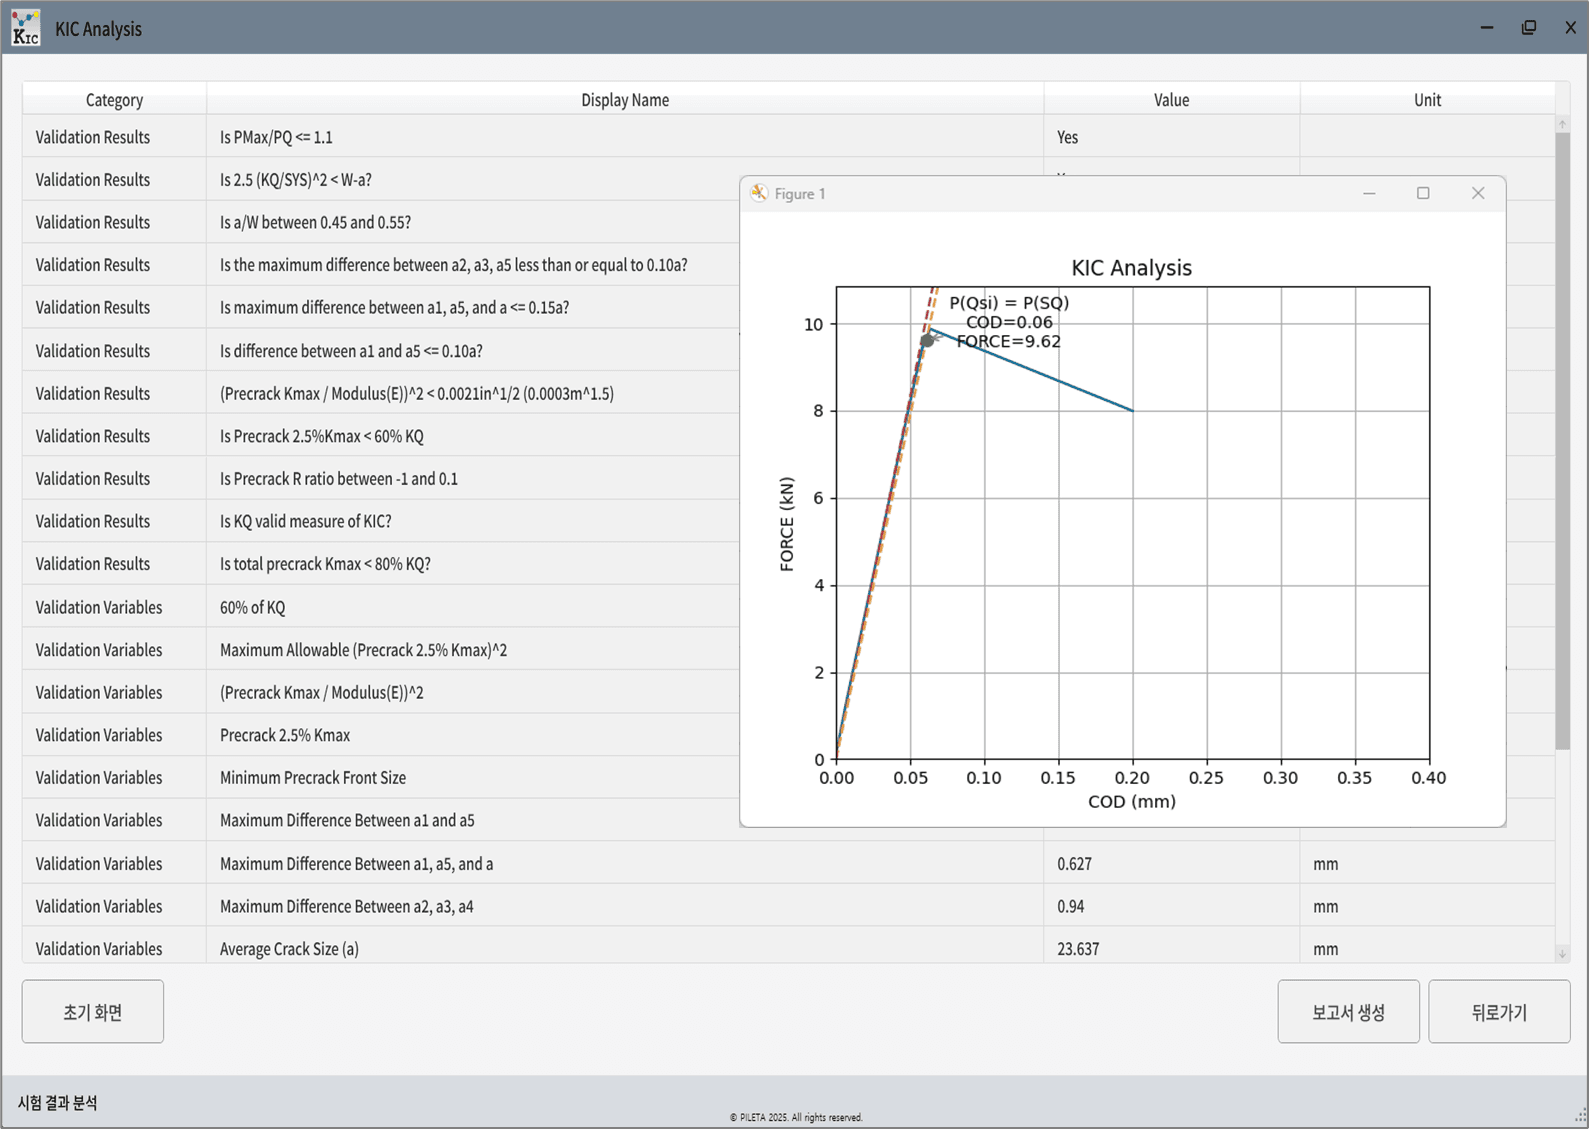
Automatically checks the validity criteria of the standard and immediately determines, with supporting evidence, whether the calculated value is a valid KIc.
Two specimen geometries supported
Built-in formulas for C(T) and SE(B) specimens automatically apply the analysis that matches the specimen geometry.
Automated visualization and test reports
Interactive charts display the load–COD curve and the 5% secant offset line, and an Excel test report is generated with a single click.
Fracture Toughness (ASTM E1820)
Automated JIc fracture toughness analysis
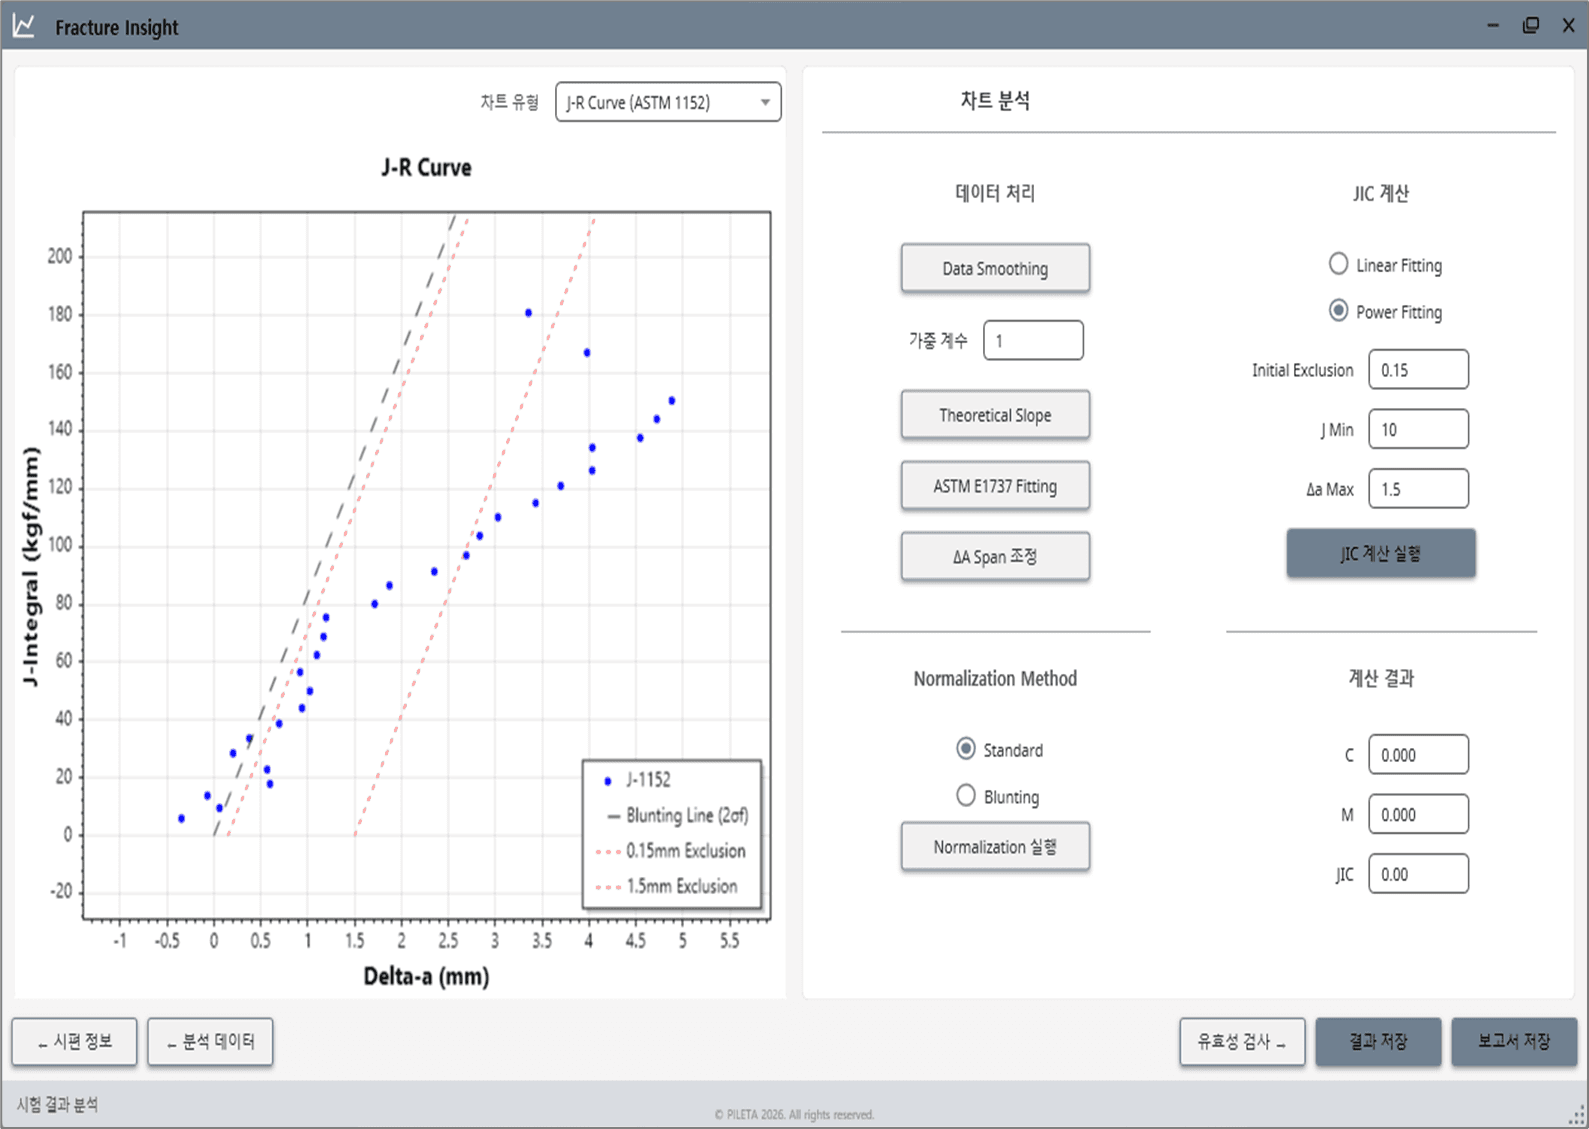
Automatic J-R curve and fracture toughness calculation per ASTM E1820
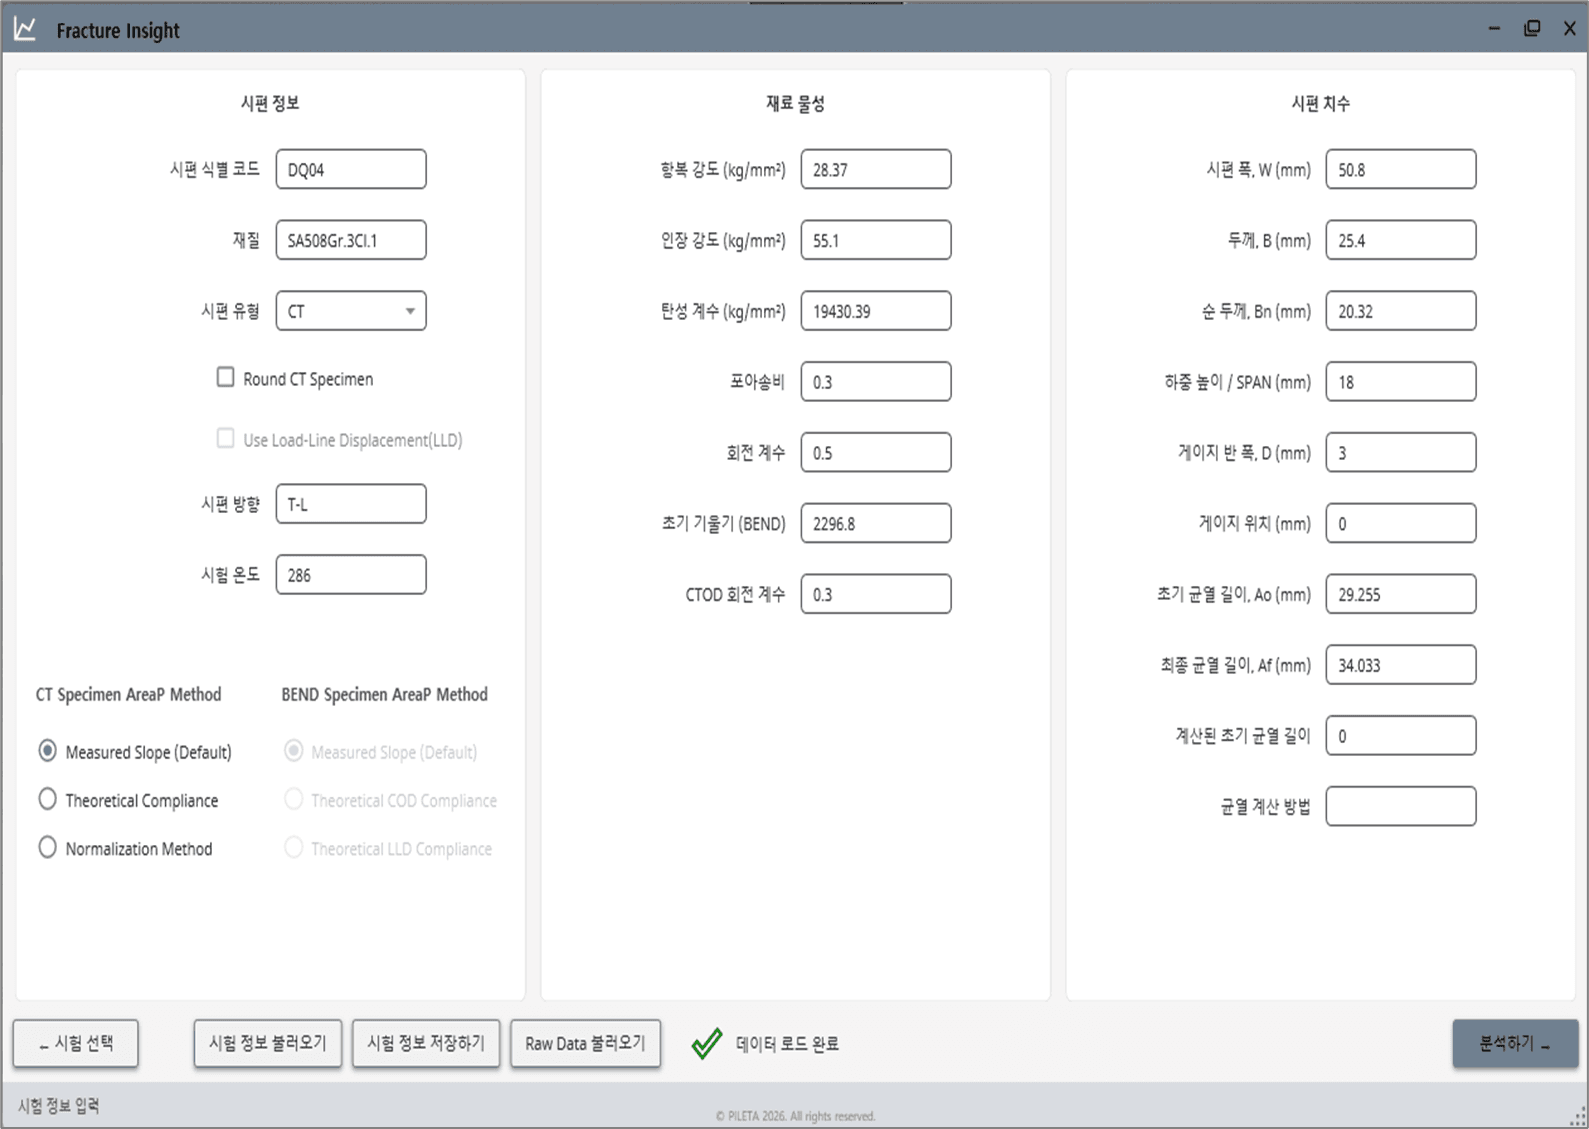
Desktop software that automatically analyzes test data in accordance with ASTM E1820 to calculate the crack growth resistance curve (J-R curve) and fracture toughness.
Standards-based automatic J-integral calculation
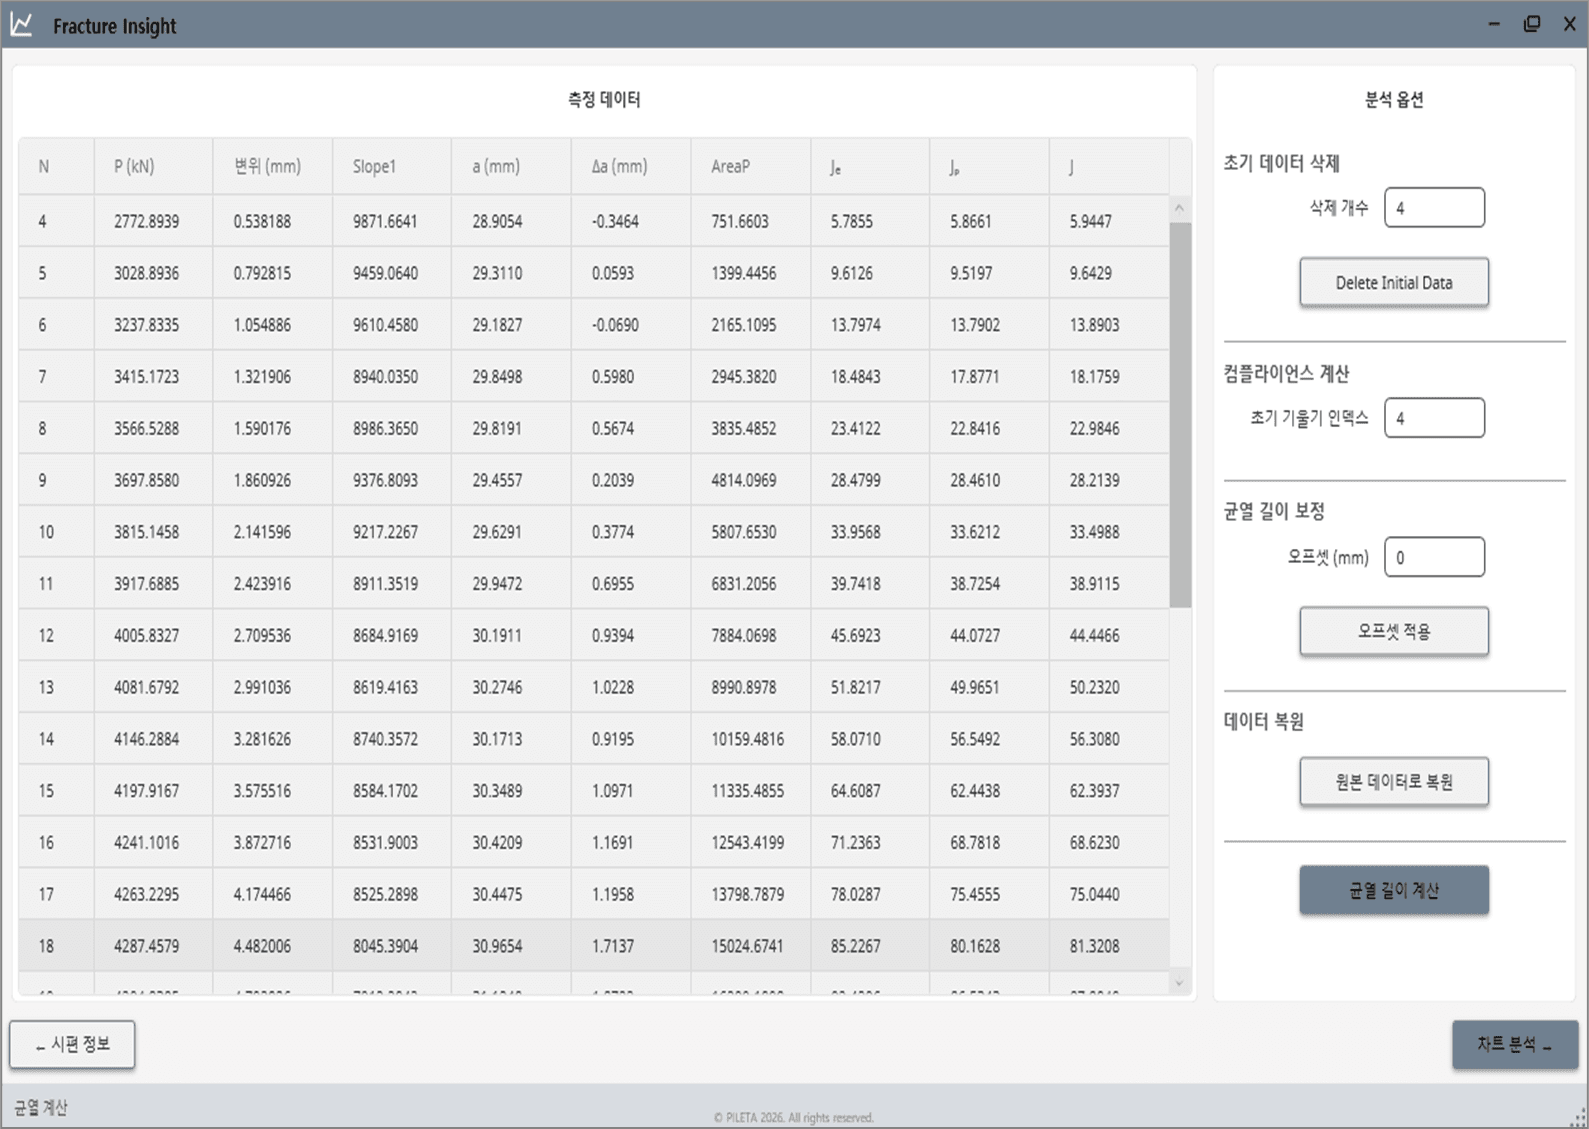
Import raw test data (CSV) to automatically calculate crack extension and the J-integral at each load step.
Automatic J-R curve and fracture toughness determination
Compiles the results into a crack growth resistance curve and automatically determines fracture toughness at the standard reference point (0.2 mm offset).
Two specimen geometries supported
Built-in formulas for C(T) and SE(B) specimens apply the analysis that matches the specimen geometry.
Automated visualization and test reports
Interactive charts display the J-R curve and load–COD curve, and test reports are generated automatically in Excel and text formats.
Grain Size Analysis
ASTM E112 grain size calculation program
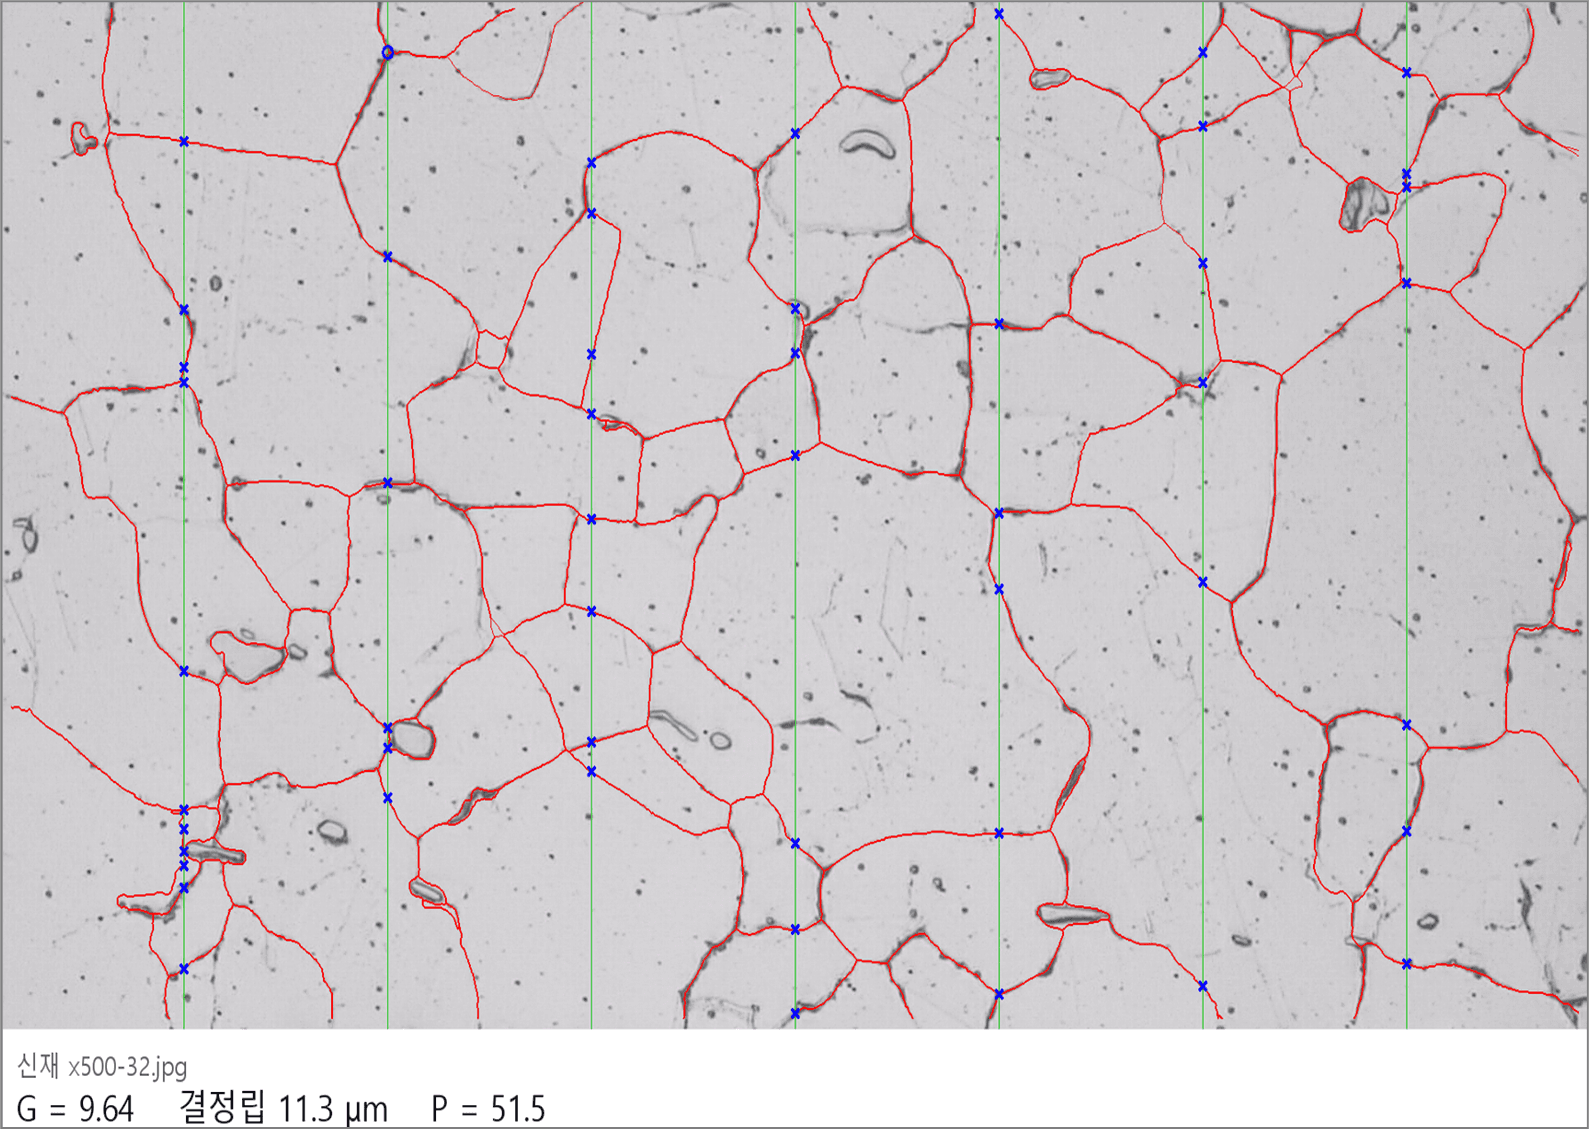
Automatic calculation of grain size number G by the ASTM E112 intercept procedure
A web-based analysis tool that automatically calculates the grain size number from metallographic microstructure images in accordance with ASTM E112.
Automated standard intercept calculation
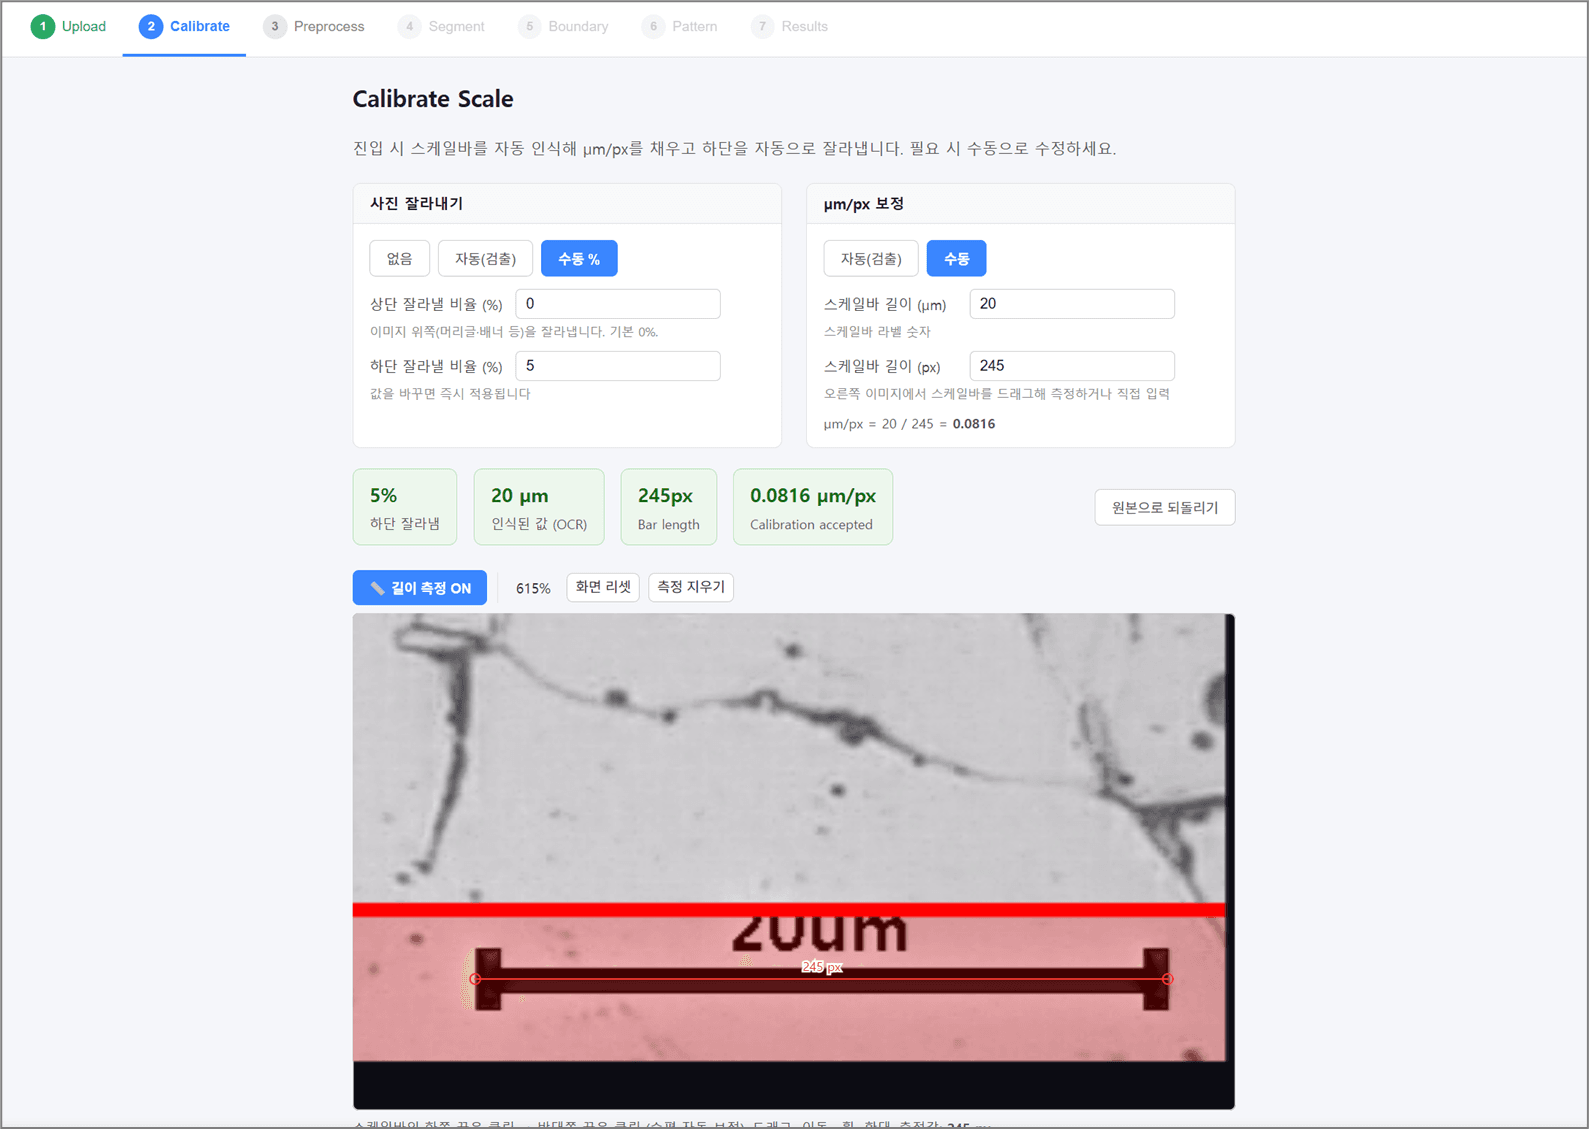
Import optical or electron microscope images to automatically calculate grain size number G using the ASTM E112 intercept procedure.
Step-by-step wizard
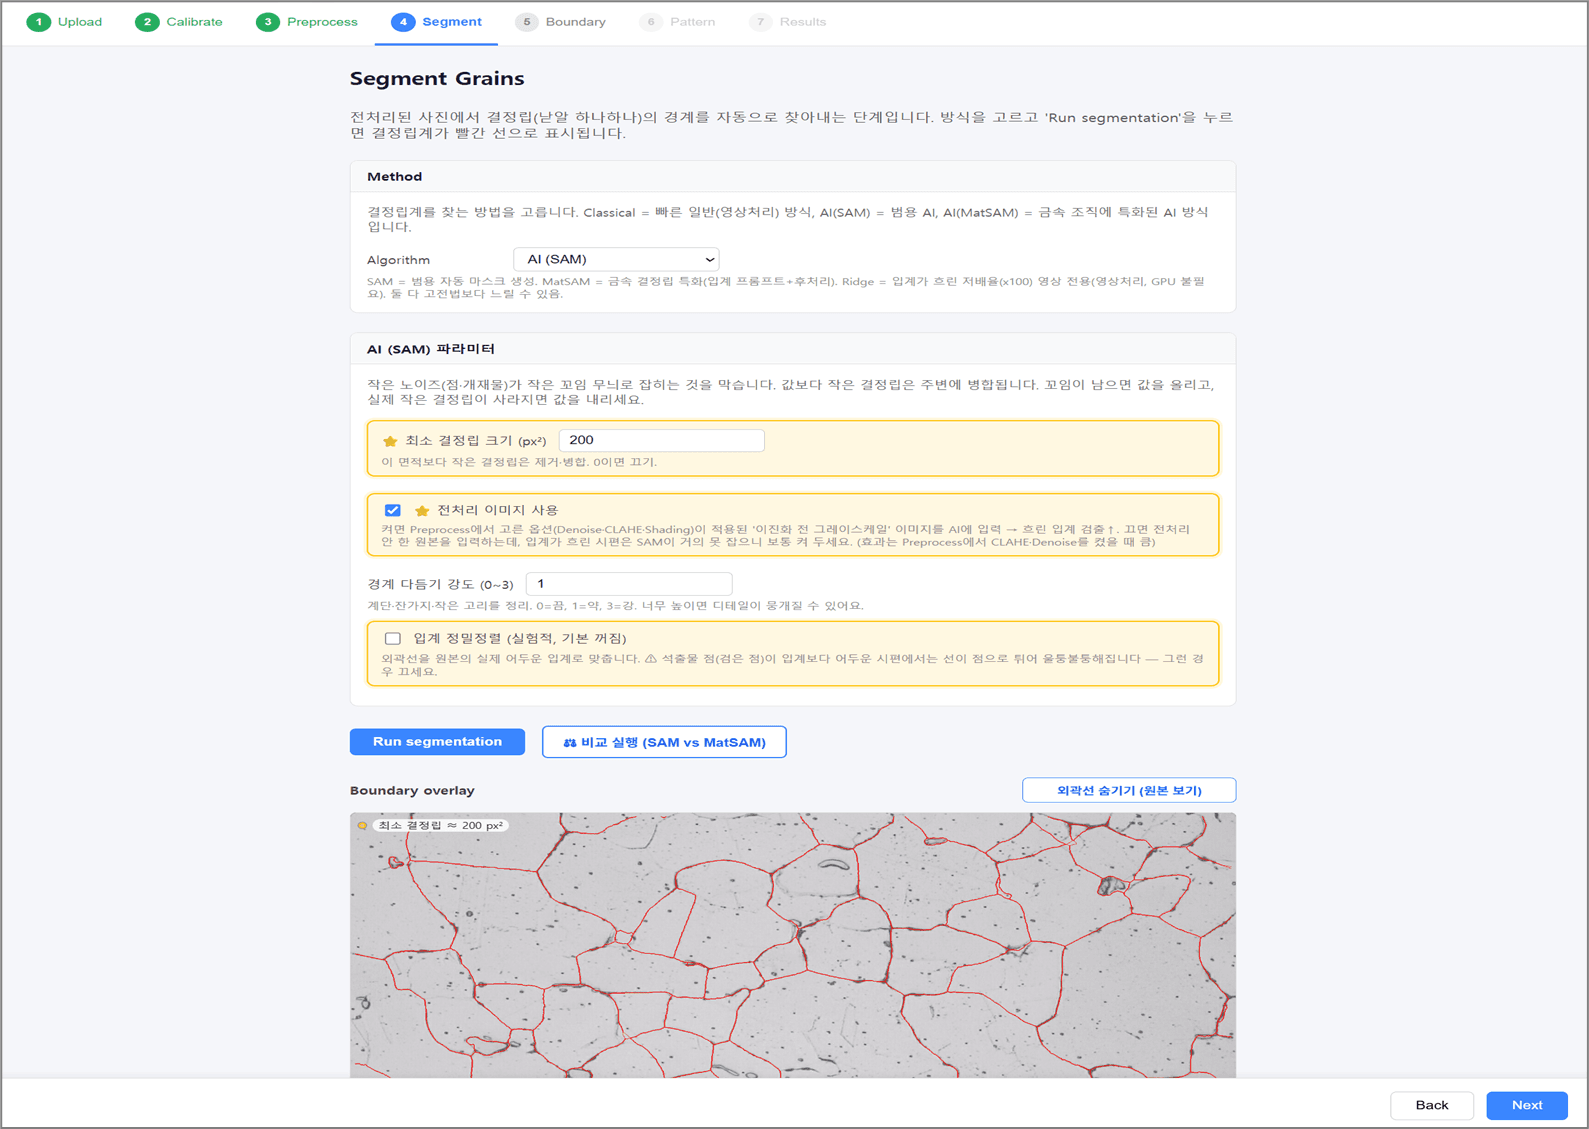
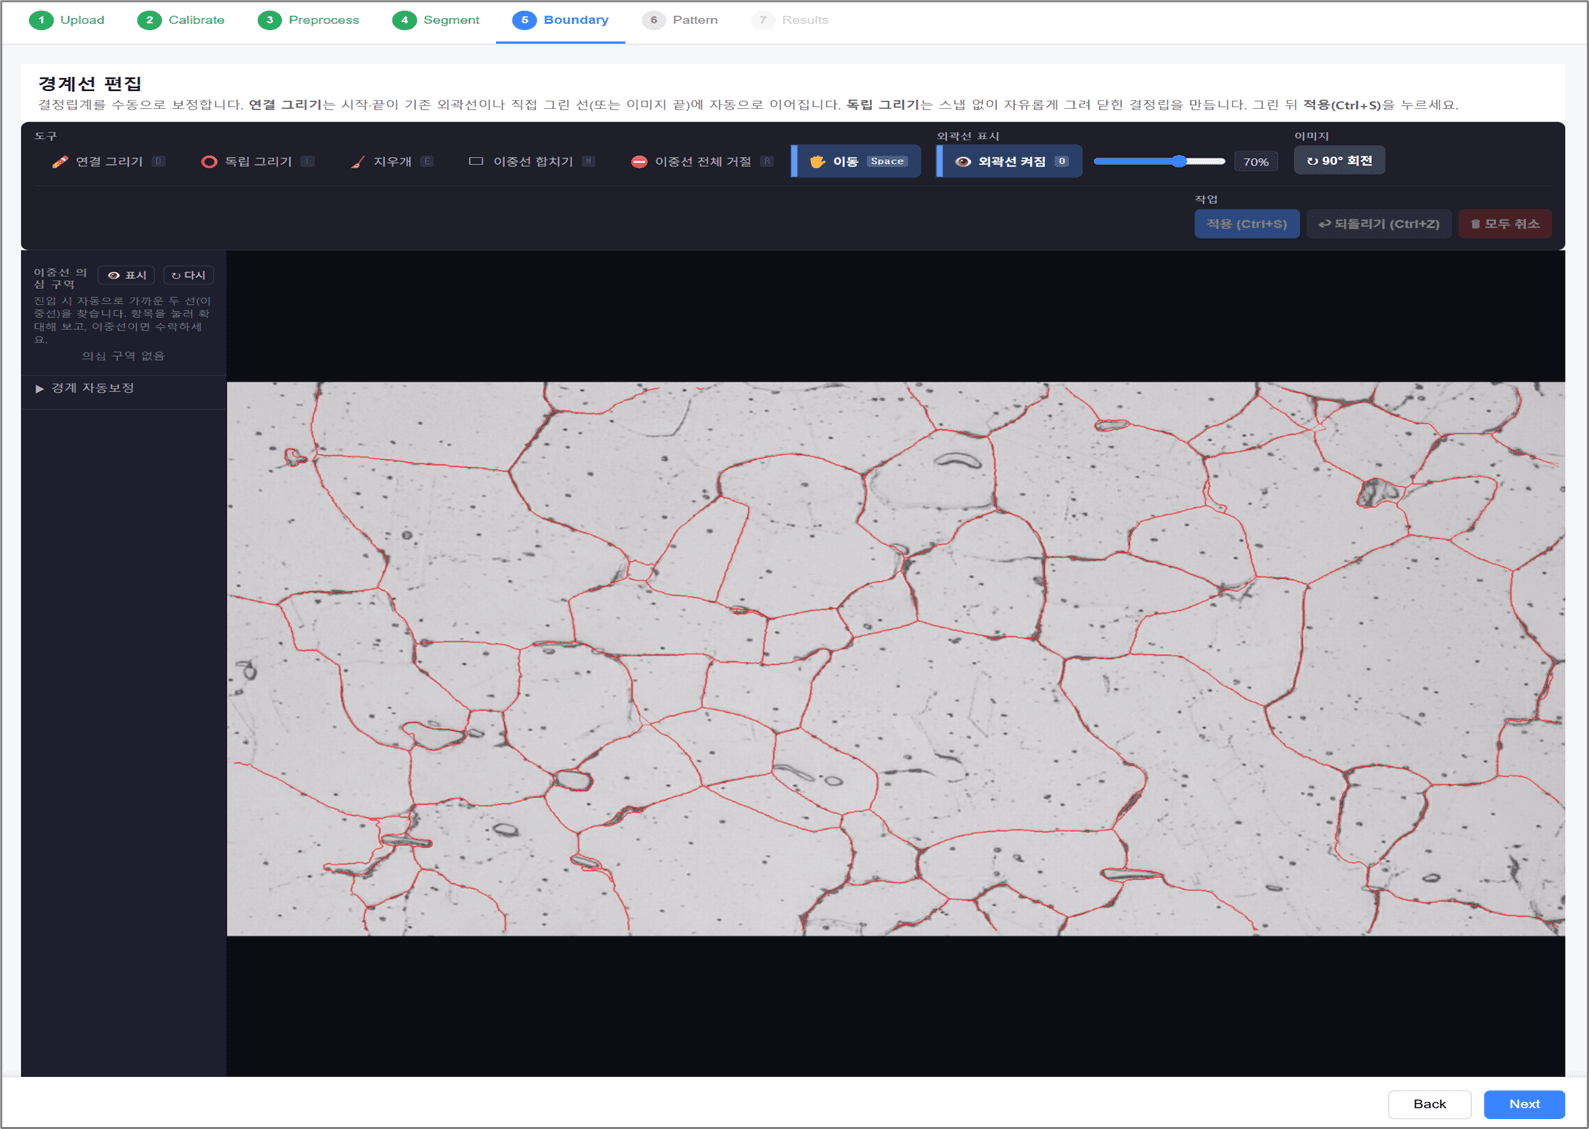
Guides users in the browser through image upload, scale calibration, preprocessing, boundary segmentation, measurement, statistics and export.
AI segmentation with reliable fallback
Offers four boundary segmentation methods (watershed, SAM, MatSAM and ridge detection), and automatically falls back to another method when AI segmentation fails on low-contrast or low-magnification images.
Automatic accumulation of retraining data
Automatically collects analysis results as a training dataset to continuously improve AI segmentation performance.
Ready When Reliability Matters
When integrity needs proof, PILETA delivers
The PILETA Test & Evaluation Center is accredited by the Korea Laboratory Accreditation Scheme (KOLAS) as a testing laboratory (Accreditation No. KT921). From testing and failure analysis to digital solution consultations, our engineers respond to you directly.
T. +82-42-368-0180 · pileta@pileta.co.kr